Stock Market Indices Analysis: February 19, 2026
U.S. equity markets exhibited cautious trading on February 19, 2026, as major indices experienced modest declines following a positive session the day prior. Investors continued to digest mixed retail earnings reports, persistent Federal Reserve commentary on inflation trends, and elevated geopolitical risks in the Middle East that contributed to a slight uptick in oil prices and broader market uncertainty. Technology shares, which had propelled recent advances through AI enthusiasm, encountered profit-taking, leading to underperformance relative to more defensive sectors.
The session highlighted an ongoing consolidation phase after the strong rally earlier in the year. Indices had approached or tested all-time highs in January and early February, fueled by optimism around artificial intelligence infrastructure investments and expectations of eventual monetary policy easing. However, stretched valuations in leading growth sectors, combined with signs of uneven economic data, prompted some rotation and reduced risk appetite. Volatility measures remained relatively subdued but edged higher, reflecting underlying caution without signaling outright panic.
On February 18, the benchmarks had posted gains amid renewed AI-related momentum. The Dow Jones Industrial Average closed at 49,662.66, rising 129.47 points or 0.26%. The S&P 500 settled at 6,881.31, up 38.09 points or 0.56%. The Nasdaq Composite finished at 22,753.63, climbing 175.25 points or 0.78%. These advances were supported by strength in semiconductor and cloud computing names, particularly following announcements of large-scale GPU deployments by major tech platforms for data center expansions.
By February 19, sentiment shifted modestly lower. Intraday updates showed the S&P 500 down around 0.3-0.5% in various reports, trading near 6,850-6,860 levels after erasing part of the prior day’s progress. The Dow declined by approximately 0.3%, shedding roughly 150 points at points during the session, while the Nasdaq faced comparable pressure from tech sector rotation. Retail sector developments, including commentary from major chains on consumer spending patterns amid lingering inflation, added to the cautious tone. Broader participation remained narrow, with mega-cap technology stocks continuing to disproportionately influence index movements.
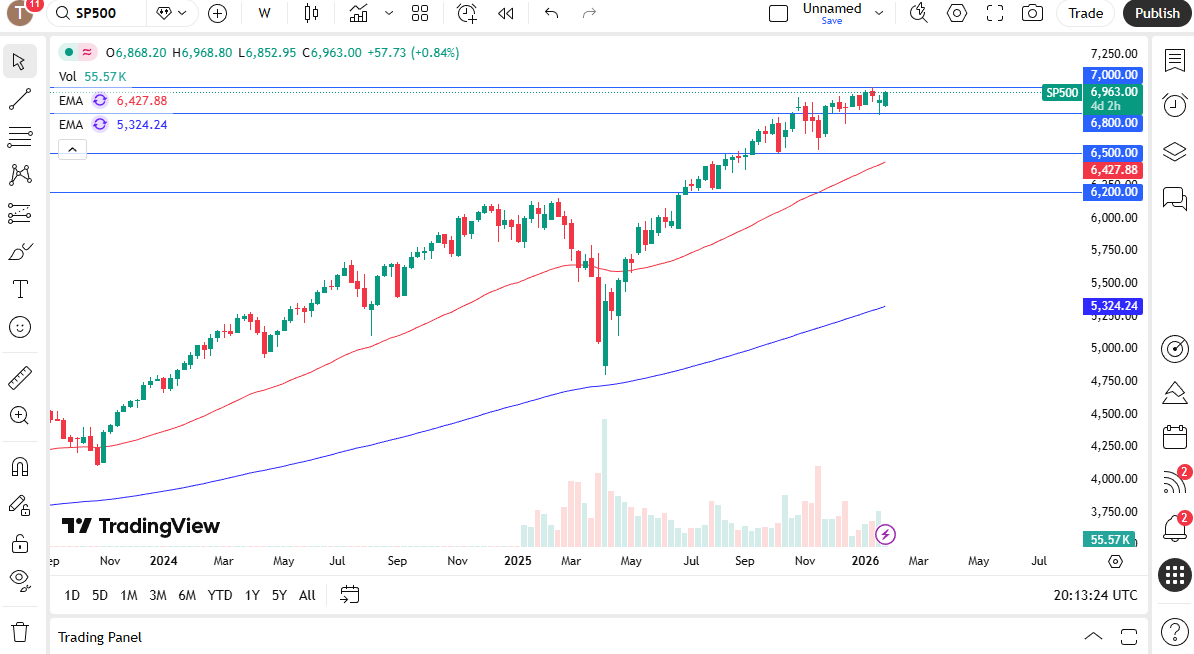
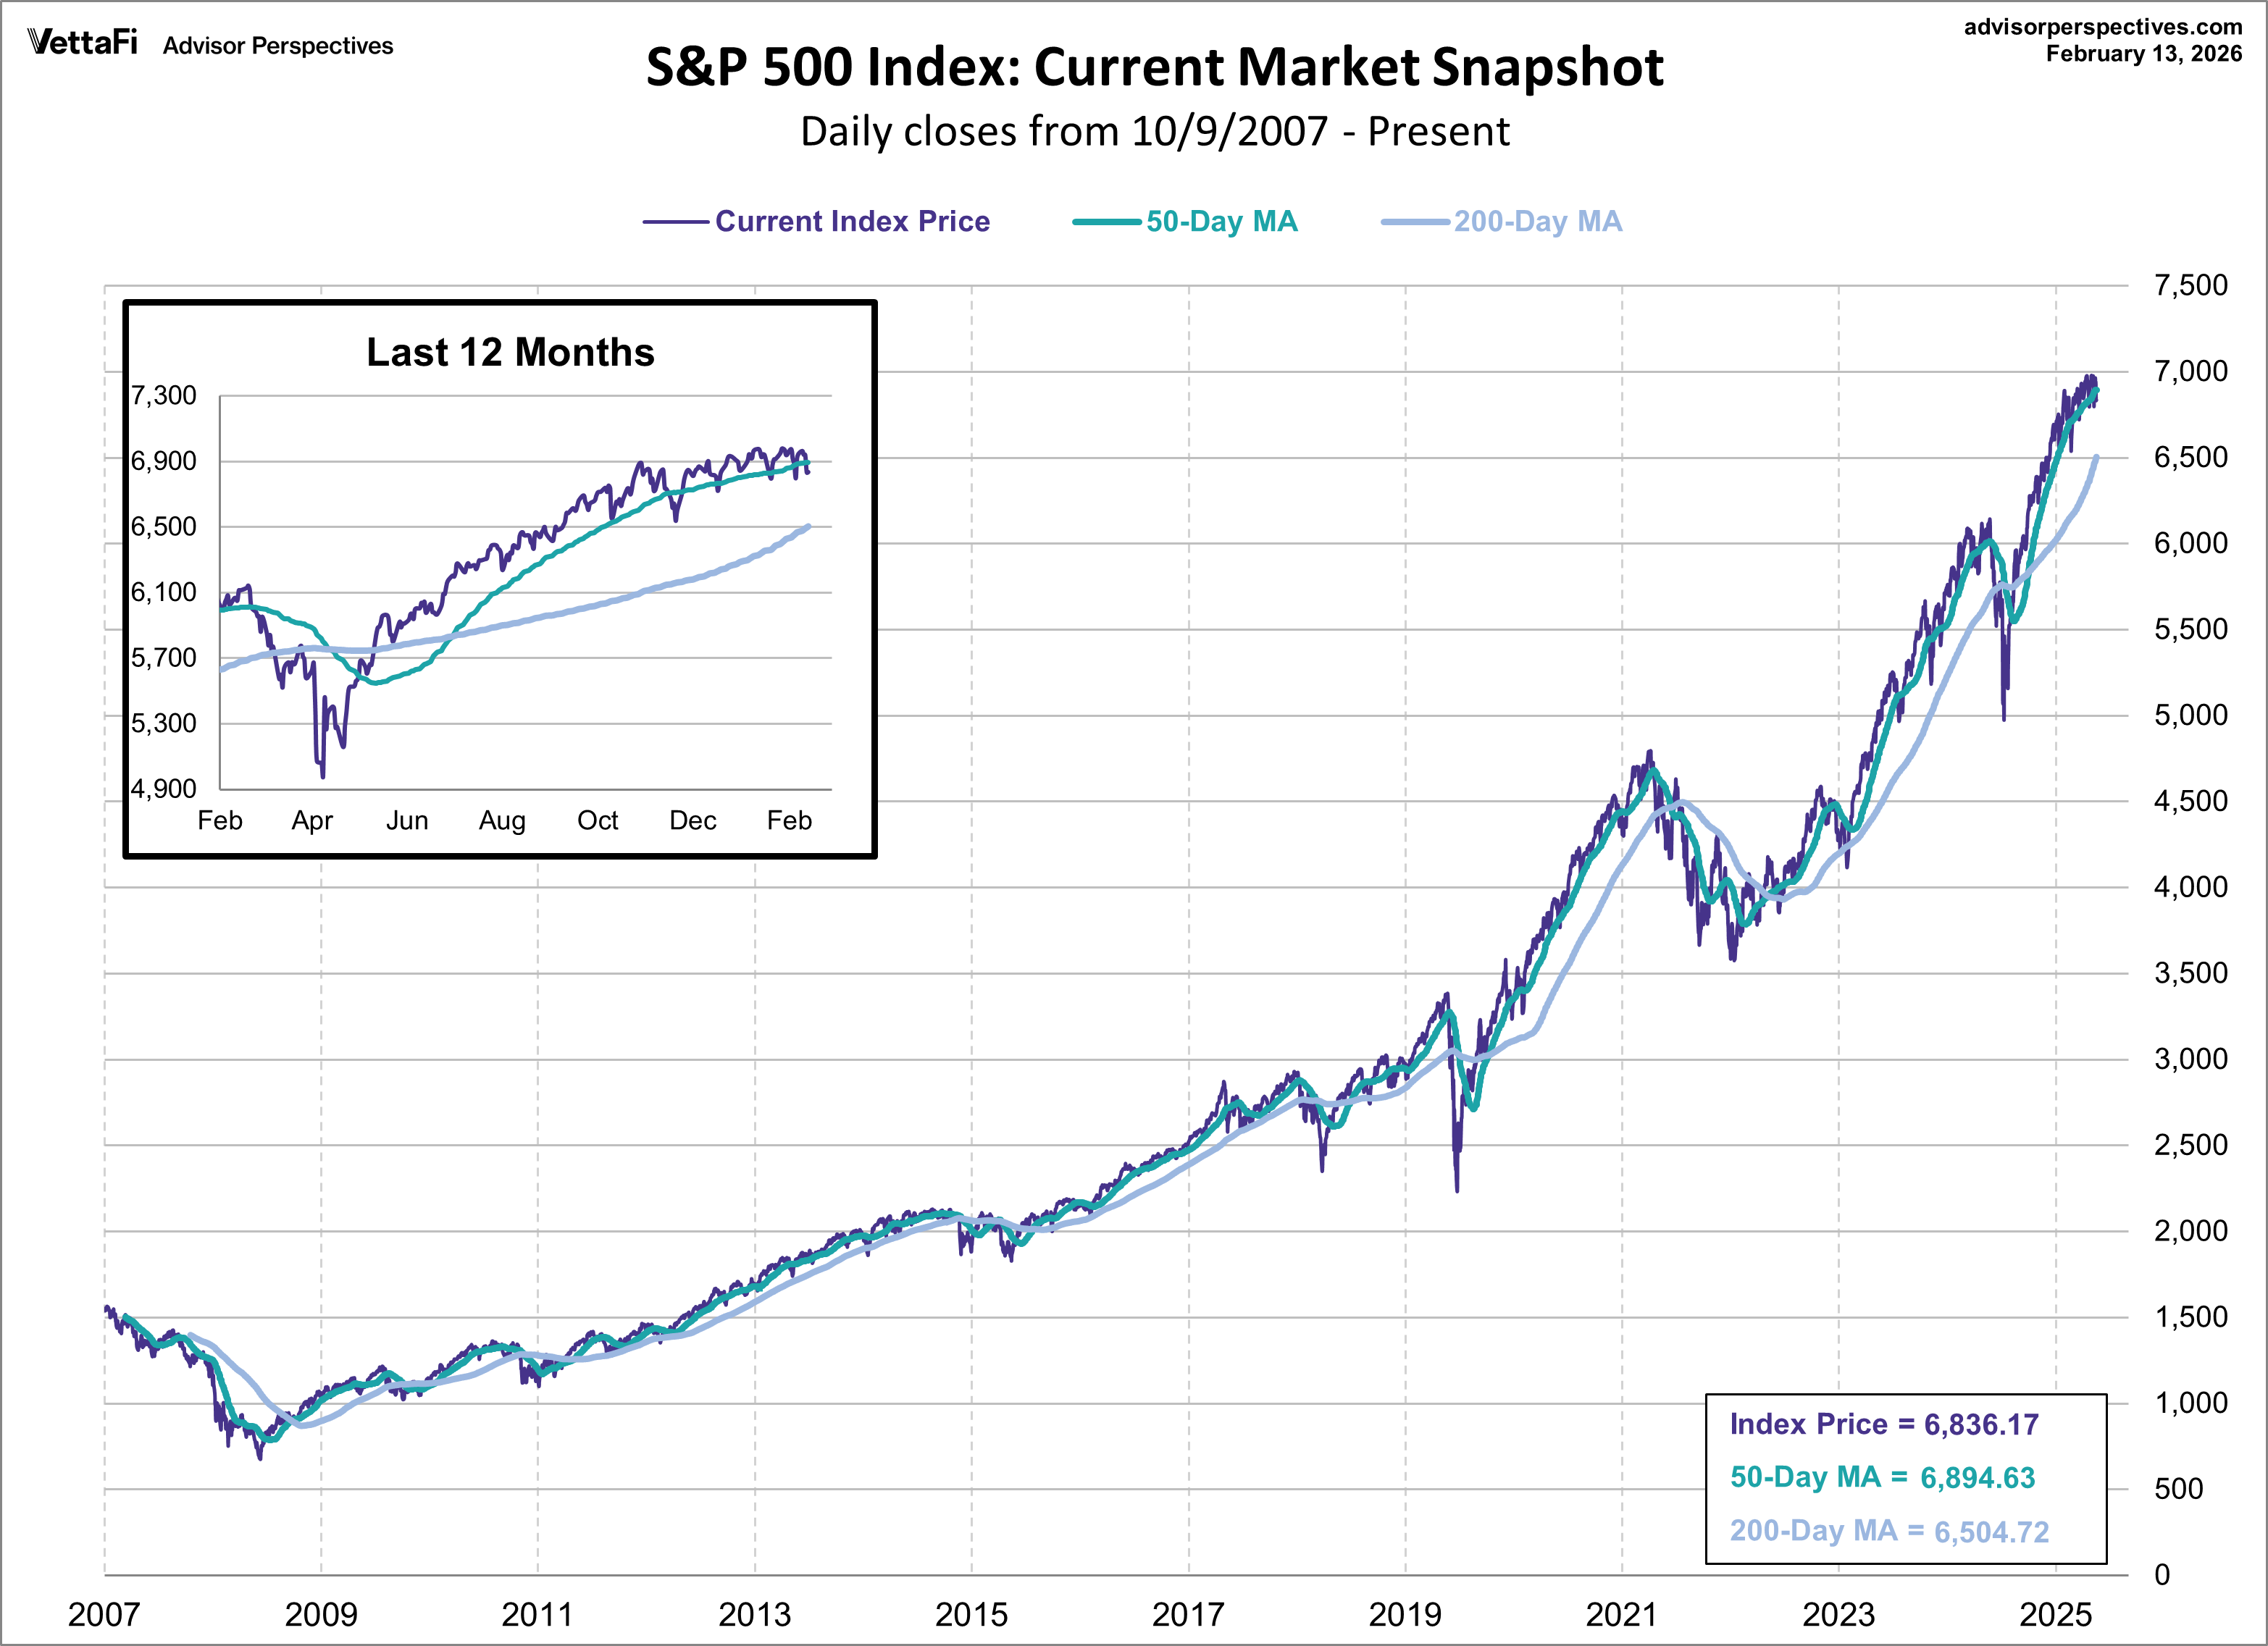
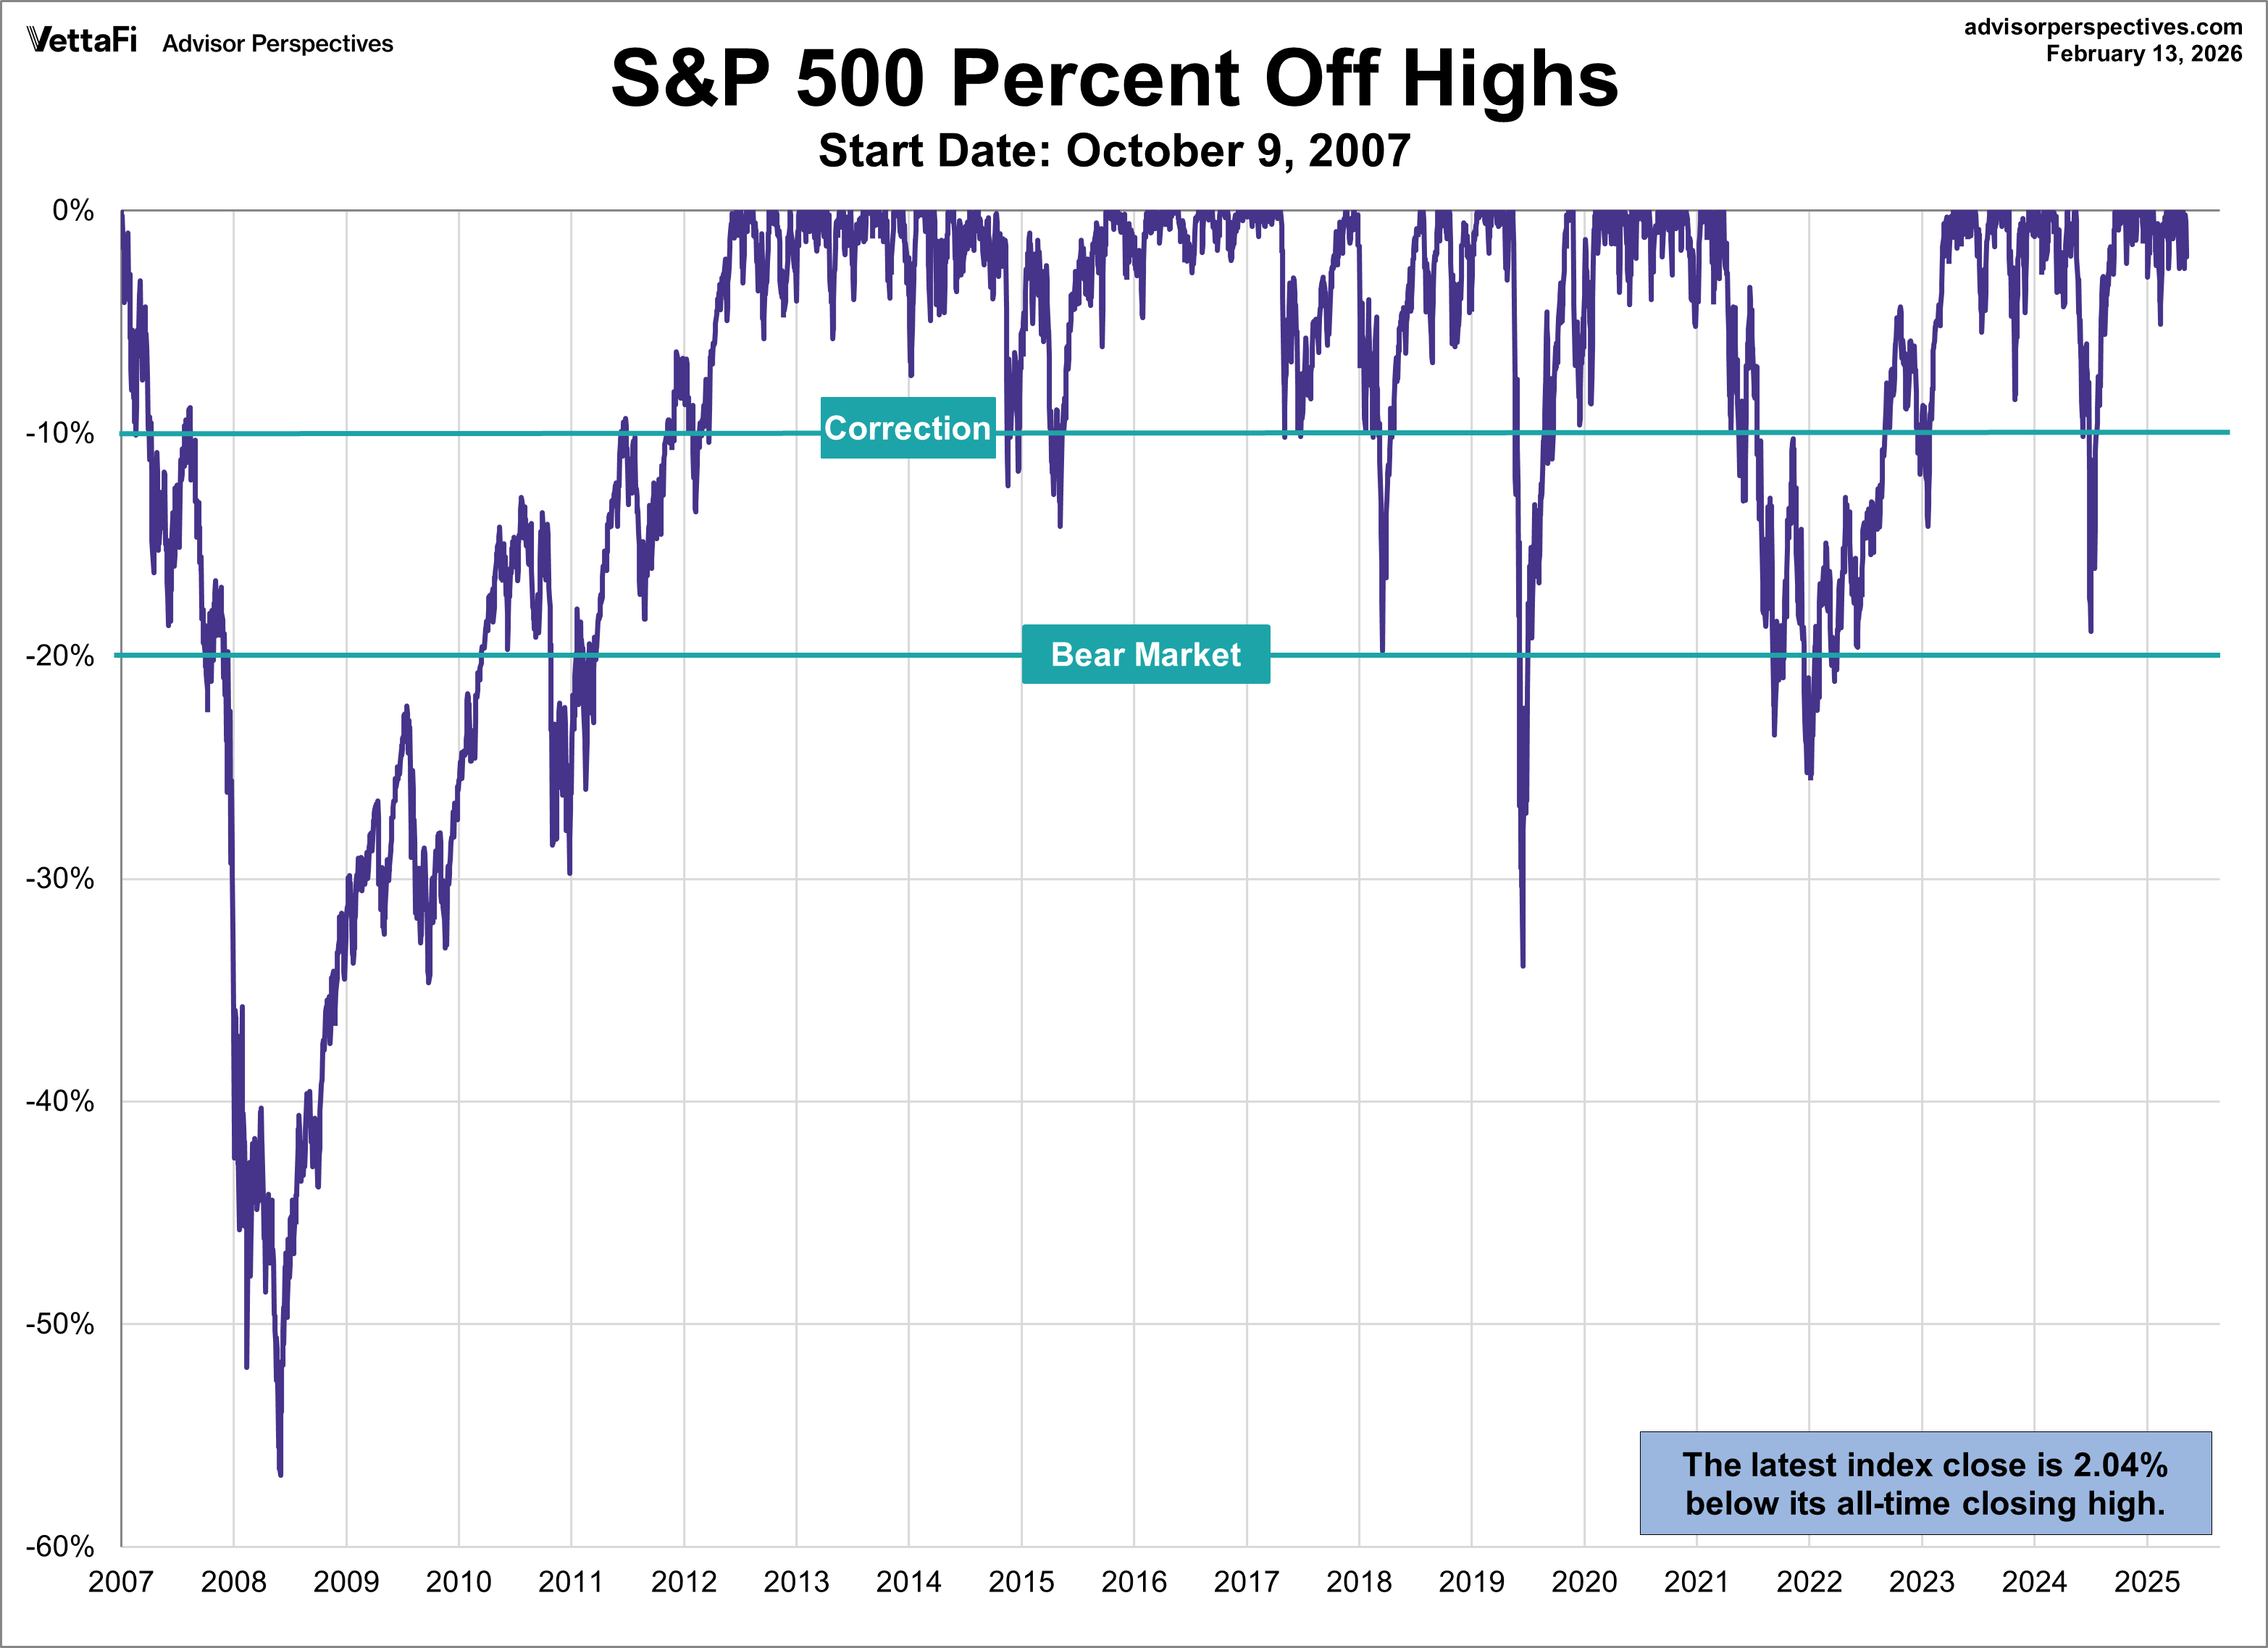
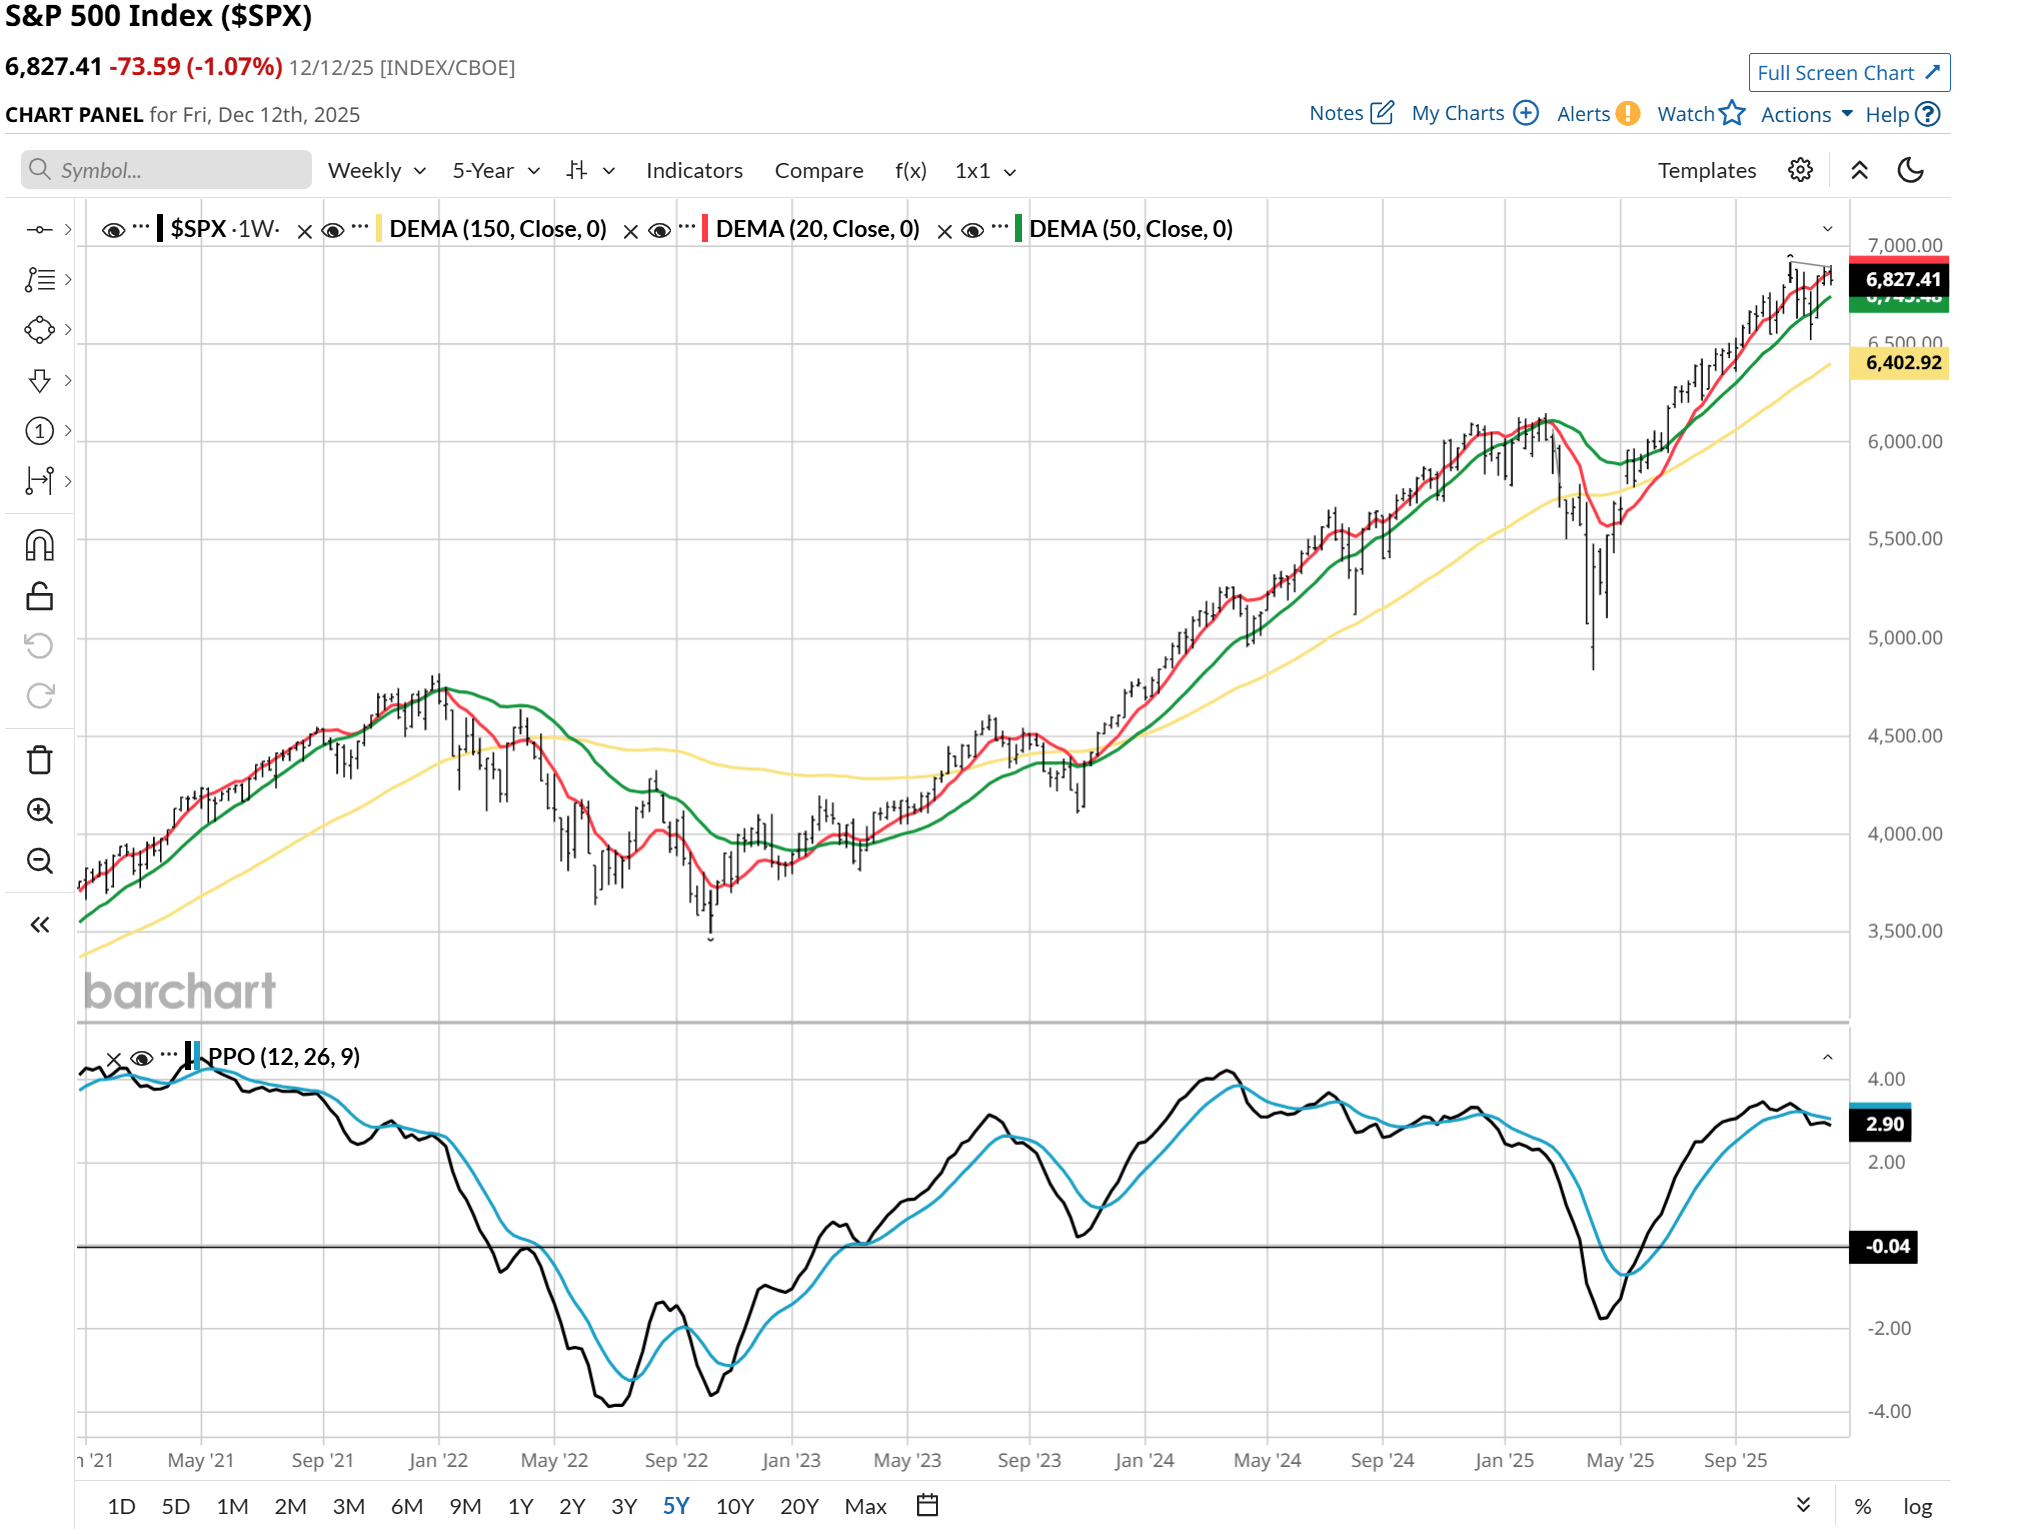
The S&P 500’s longer-term trajectory illustrates a sustained bullish trend since mid-2024 lows, with the index maintaining above critical long-term moving averages despite periodic pullbacks. Recent price action has featured consolidation near upper resistance zones, where sellers have emerged on strength, but buyers have defended key support levels around prior swing highs and dynamic trendlines.
:max_bytes(150000):strip_icc()/DDOG_2026-02-10_13-59-05-ab4e397293c04c3ba8df3e9b41aca5b7.png)
The Nasdaq Composite, with its heavier weighting toward growth and innovation themes, has shown even more pronounced upside momentum in recent years. Its path reflects explosive advances tied to AI and digital transformation, though it has also experienced sharper corrections during periods of sentiment shifts. Current levels in the low-to-mid 22,000s represent significant technical zones where historical support and resistance have played out.

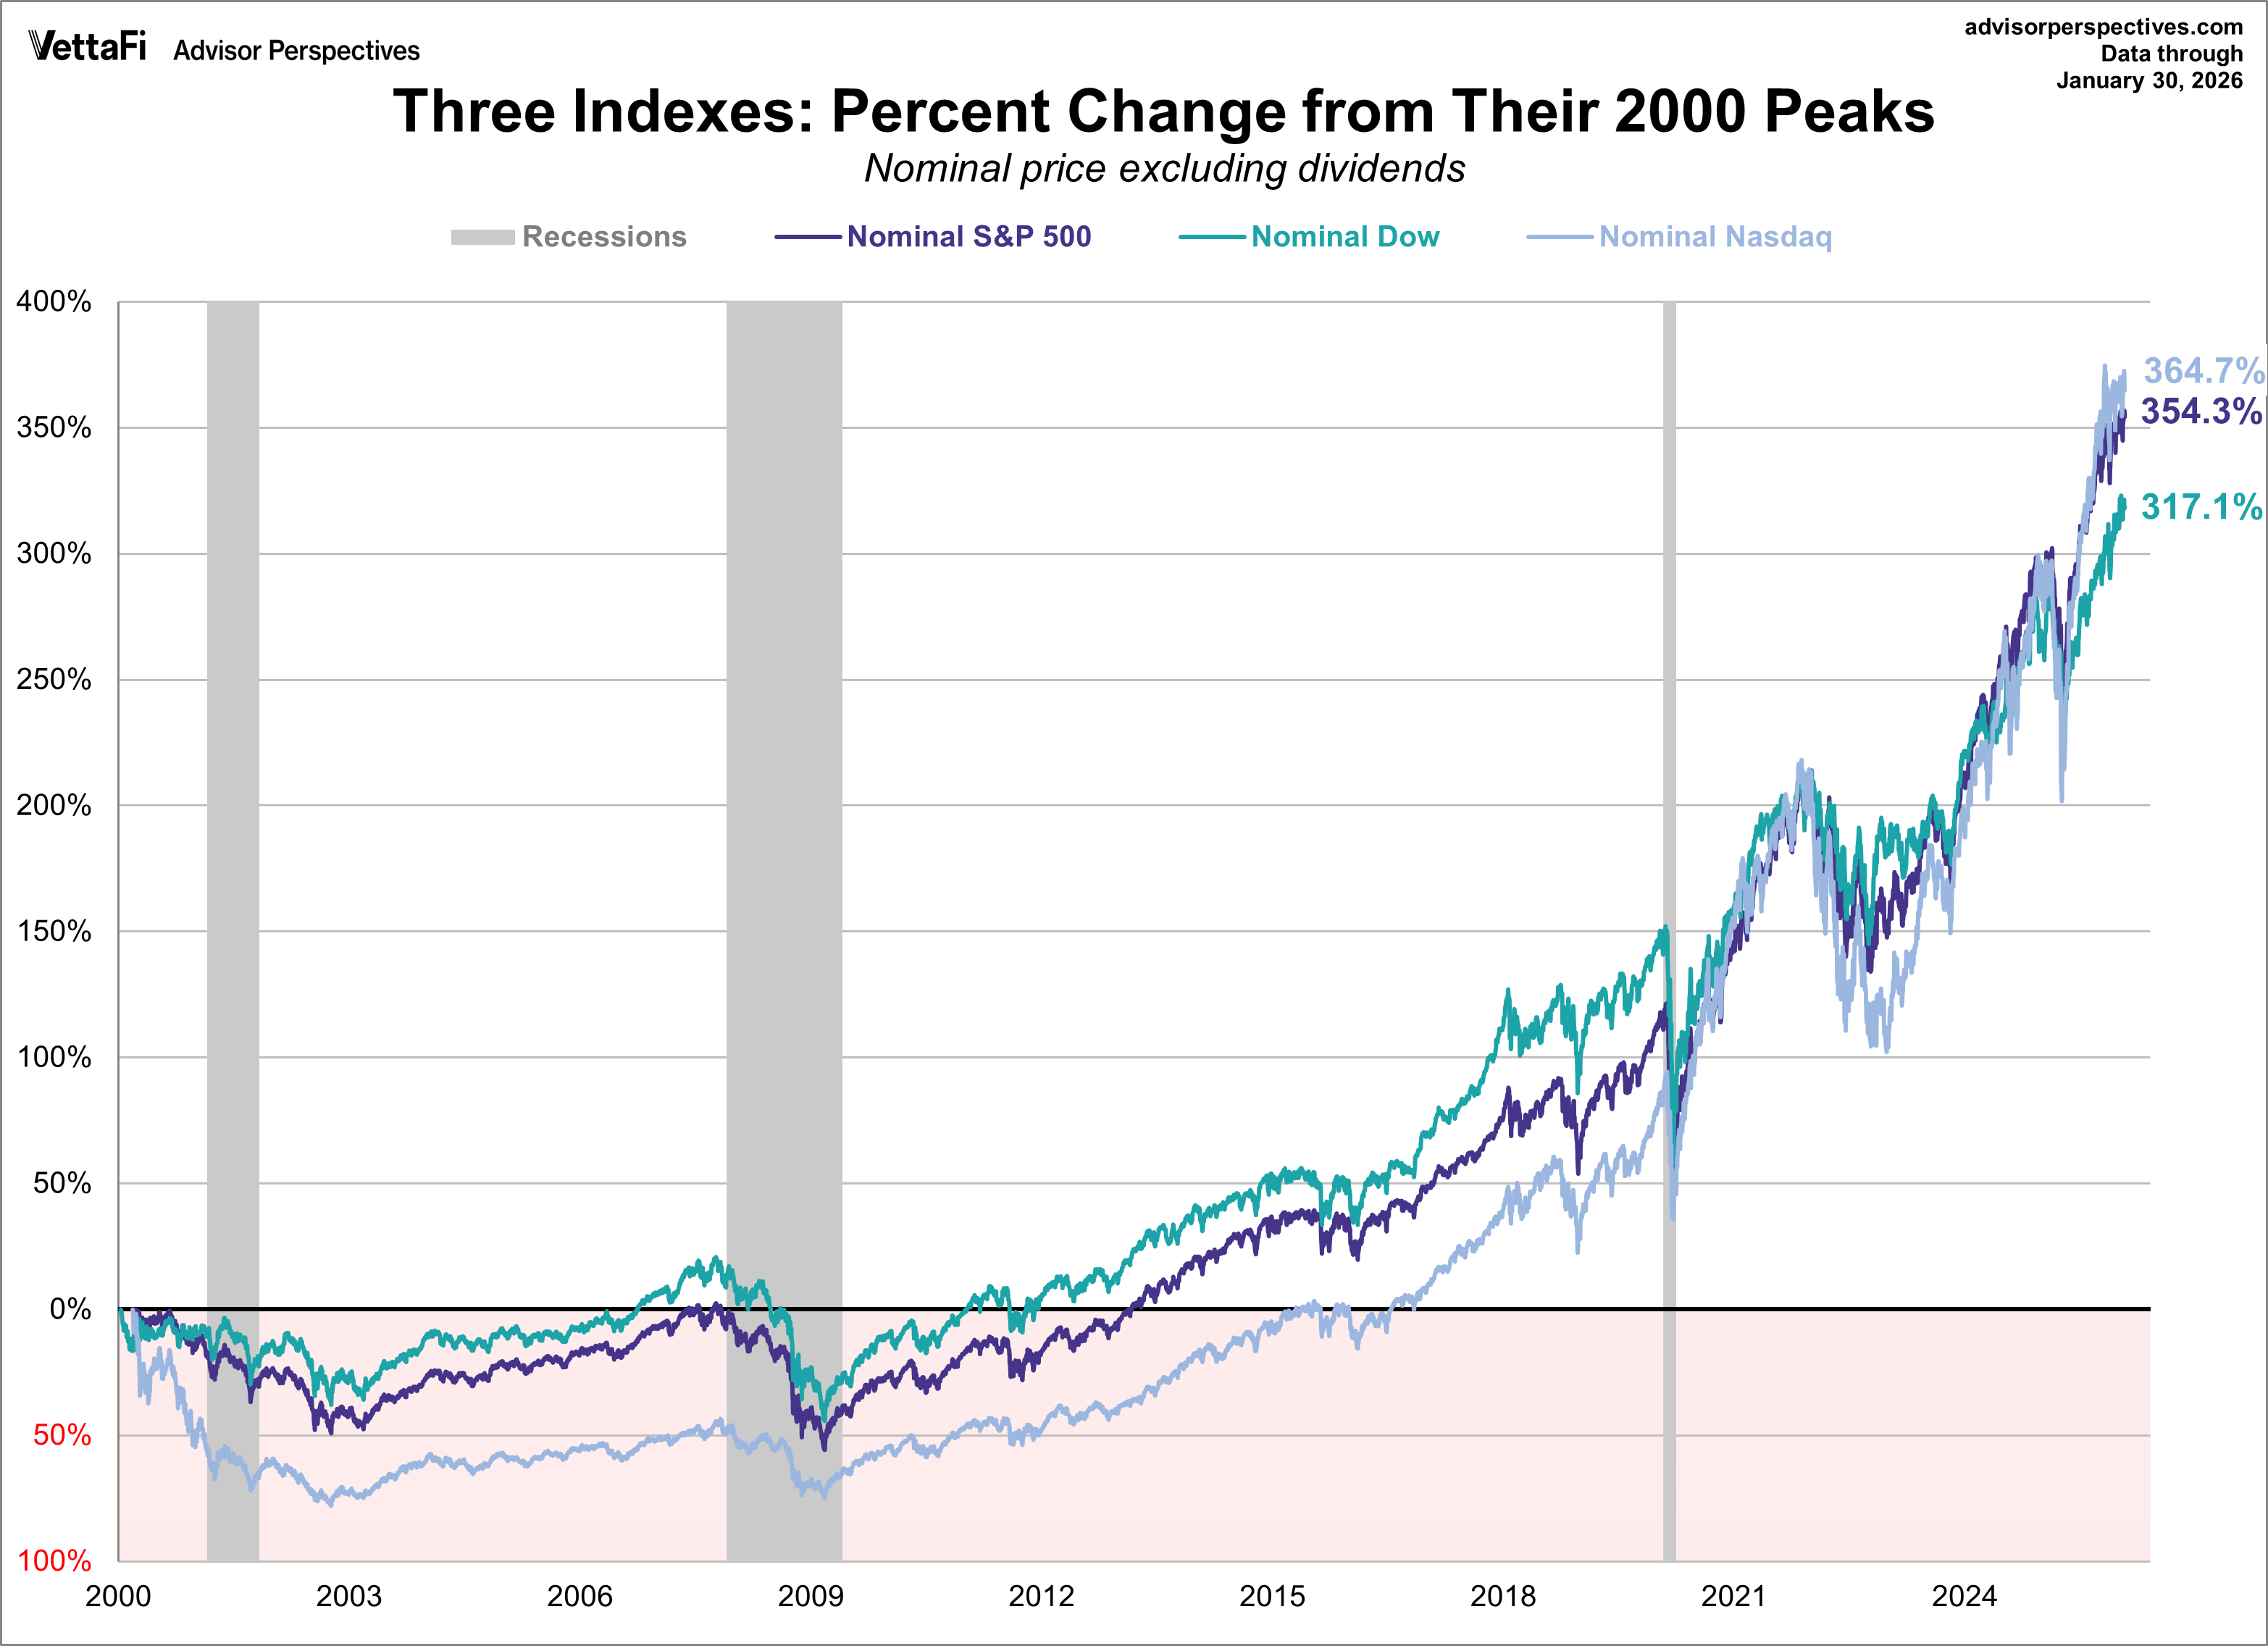
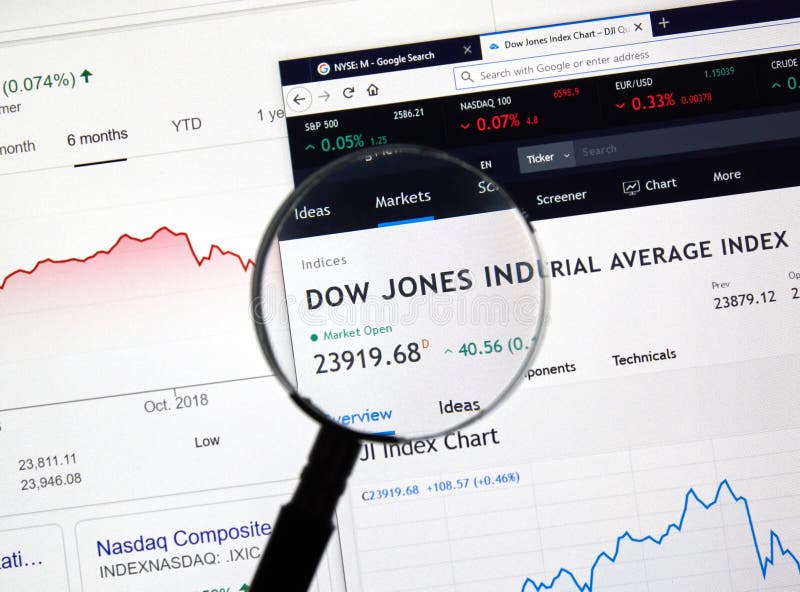
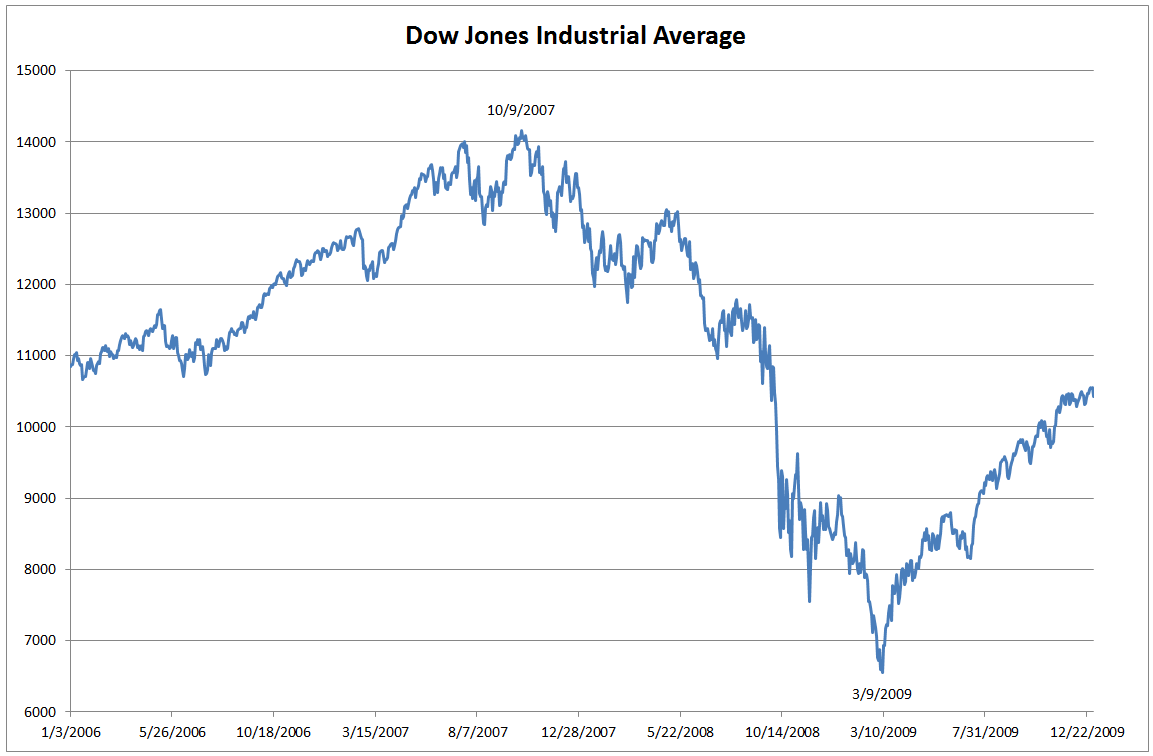
The Dow Jones Industrial Average provides a more balanced perspective on market health, incorporating a mix of industrial, financial, and consumer-oriented components. Its historical chart underscores resilience through multiple economic cycles, with recent positioning near 49,000-50,000 reflecting steady performance even as it has trailed tech-heavy indices in percentage terms during the AI-led surge.

The trading floor at the New York Stock Exchange remains a visual emblem of institutional activity, even as electronic trading dominates volume. Images of bustling activity capture the intensity during key sessions, where human decision-making intersects with algorithmic execution.


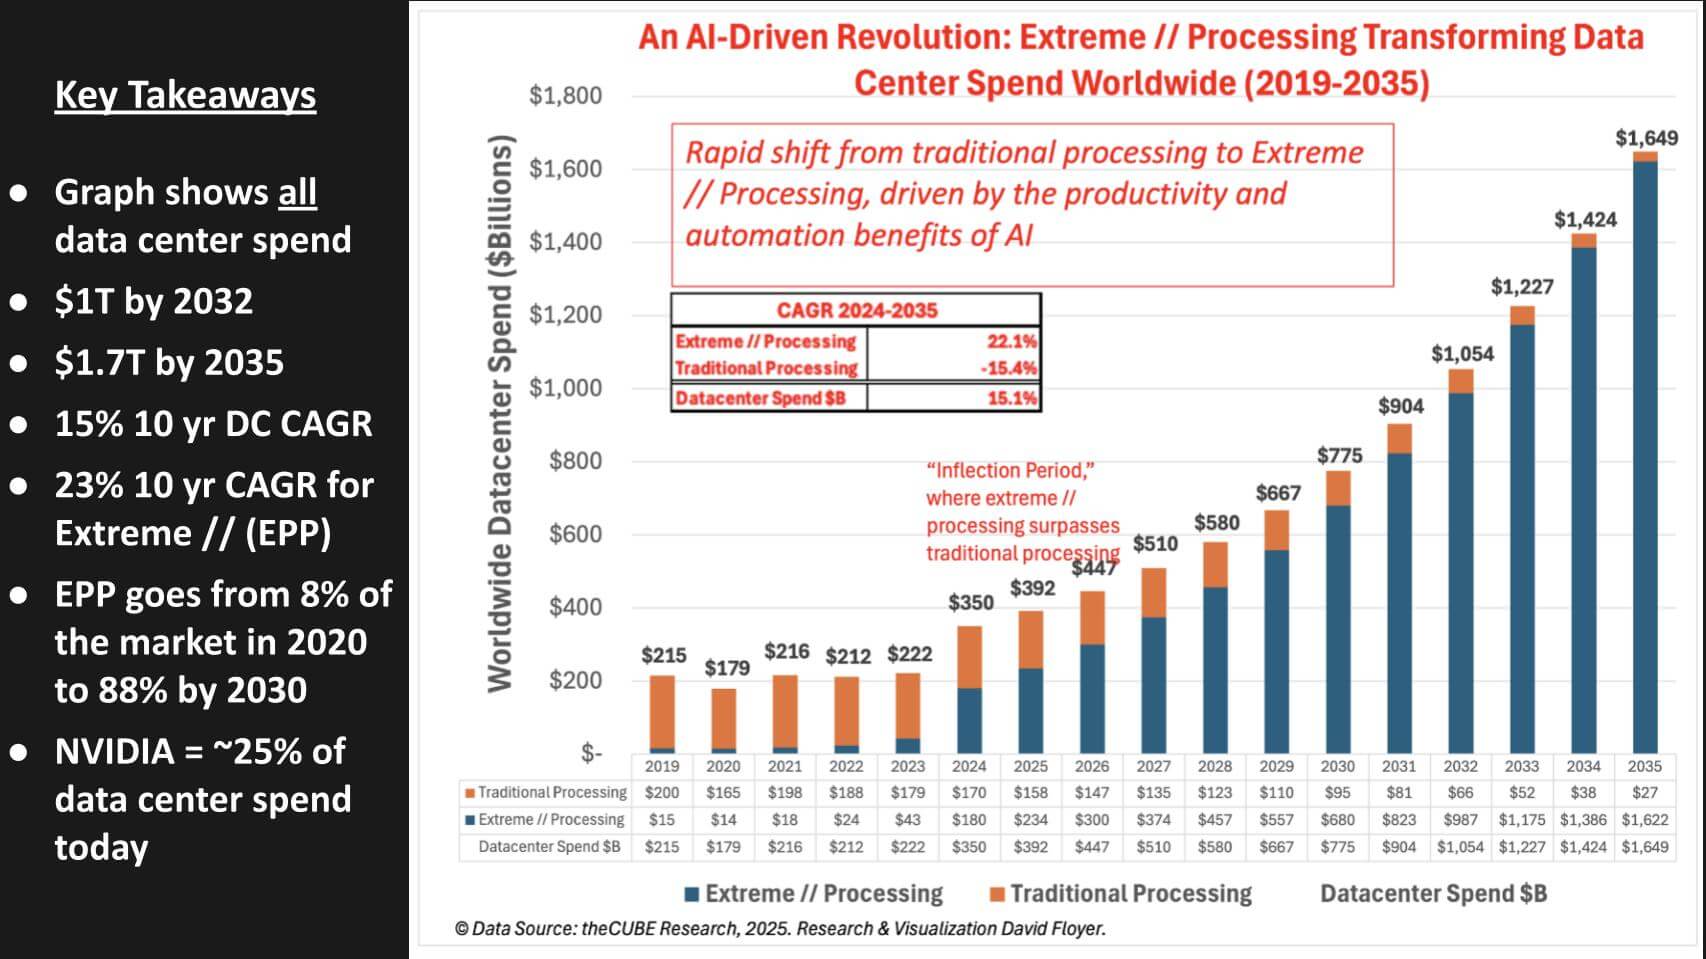
AI infrastructure continued to influence sentiment, with ongoing investments in data centers and advanced GPUs driving interest in related semiconductor plays. Charts depicting data center revenue growth for leading players highlight the explosive expansion in this segment, underscoring why technology remains a focal point despite near-term volatility.
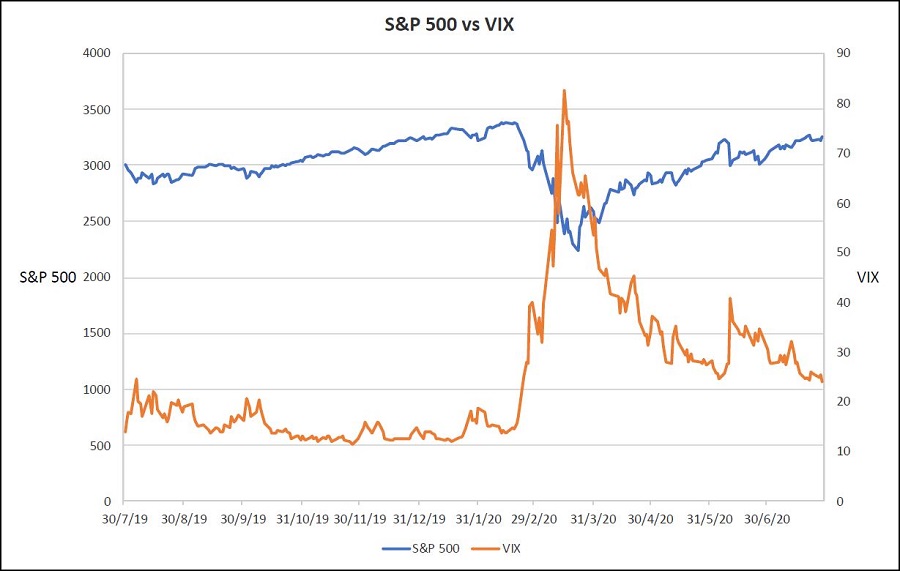
The VIX, often referred to as the market’s “fear gauge,” showed a slight increase during the session, indicating modestly heightened uncertainty without reaching elevated levels typically associated with broader sell-offs. Historical comparisons of the VIX against major indices reveal its inverse relationship during periods of stress, providing context for current readings.

:max_bytes(150000):strip_icc()/dotdash_Final_The_Volatility_Index_Reading_Market_Sentiment_Jun_2020-02-289fe05ed33d4ddebe4cbe9b6d098d6b.jpg)
Sector dynamics on February 19 favored relative strength in defensives such as utilities and consumer staples, while high-growth areas like communication services and discretionary faced more pressure. Financials held up reasonably well amid rate expectations, and energy benefited from geopolitical headlines. The overall market posture remains constructive, supported by solid corporate fundamentals and the ongoing AI investment cycle, though risks from policy, inflation, and global events warrant vigilance.
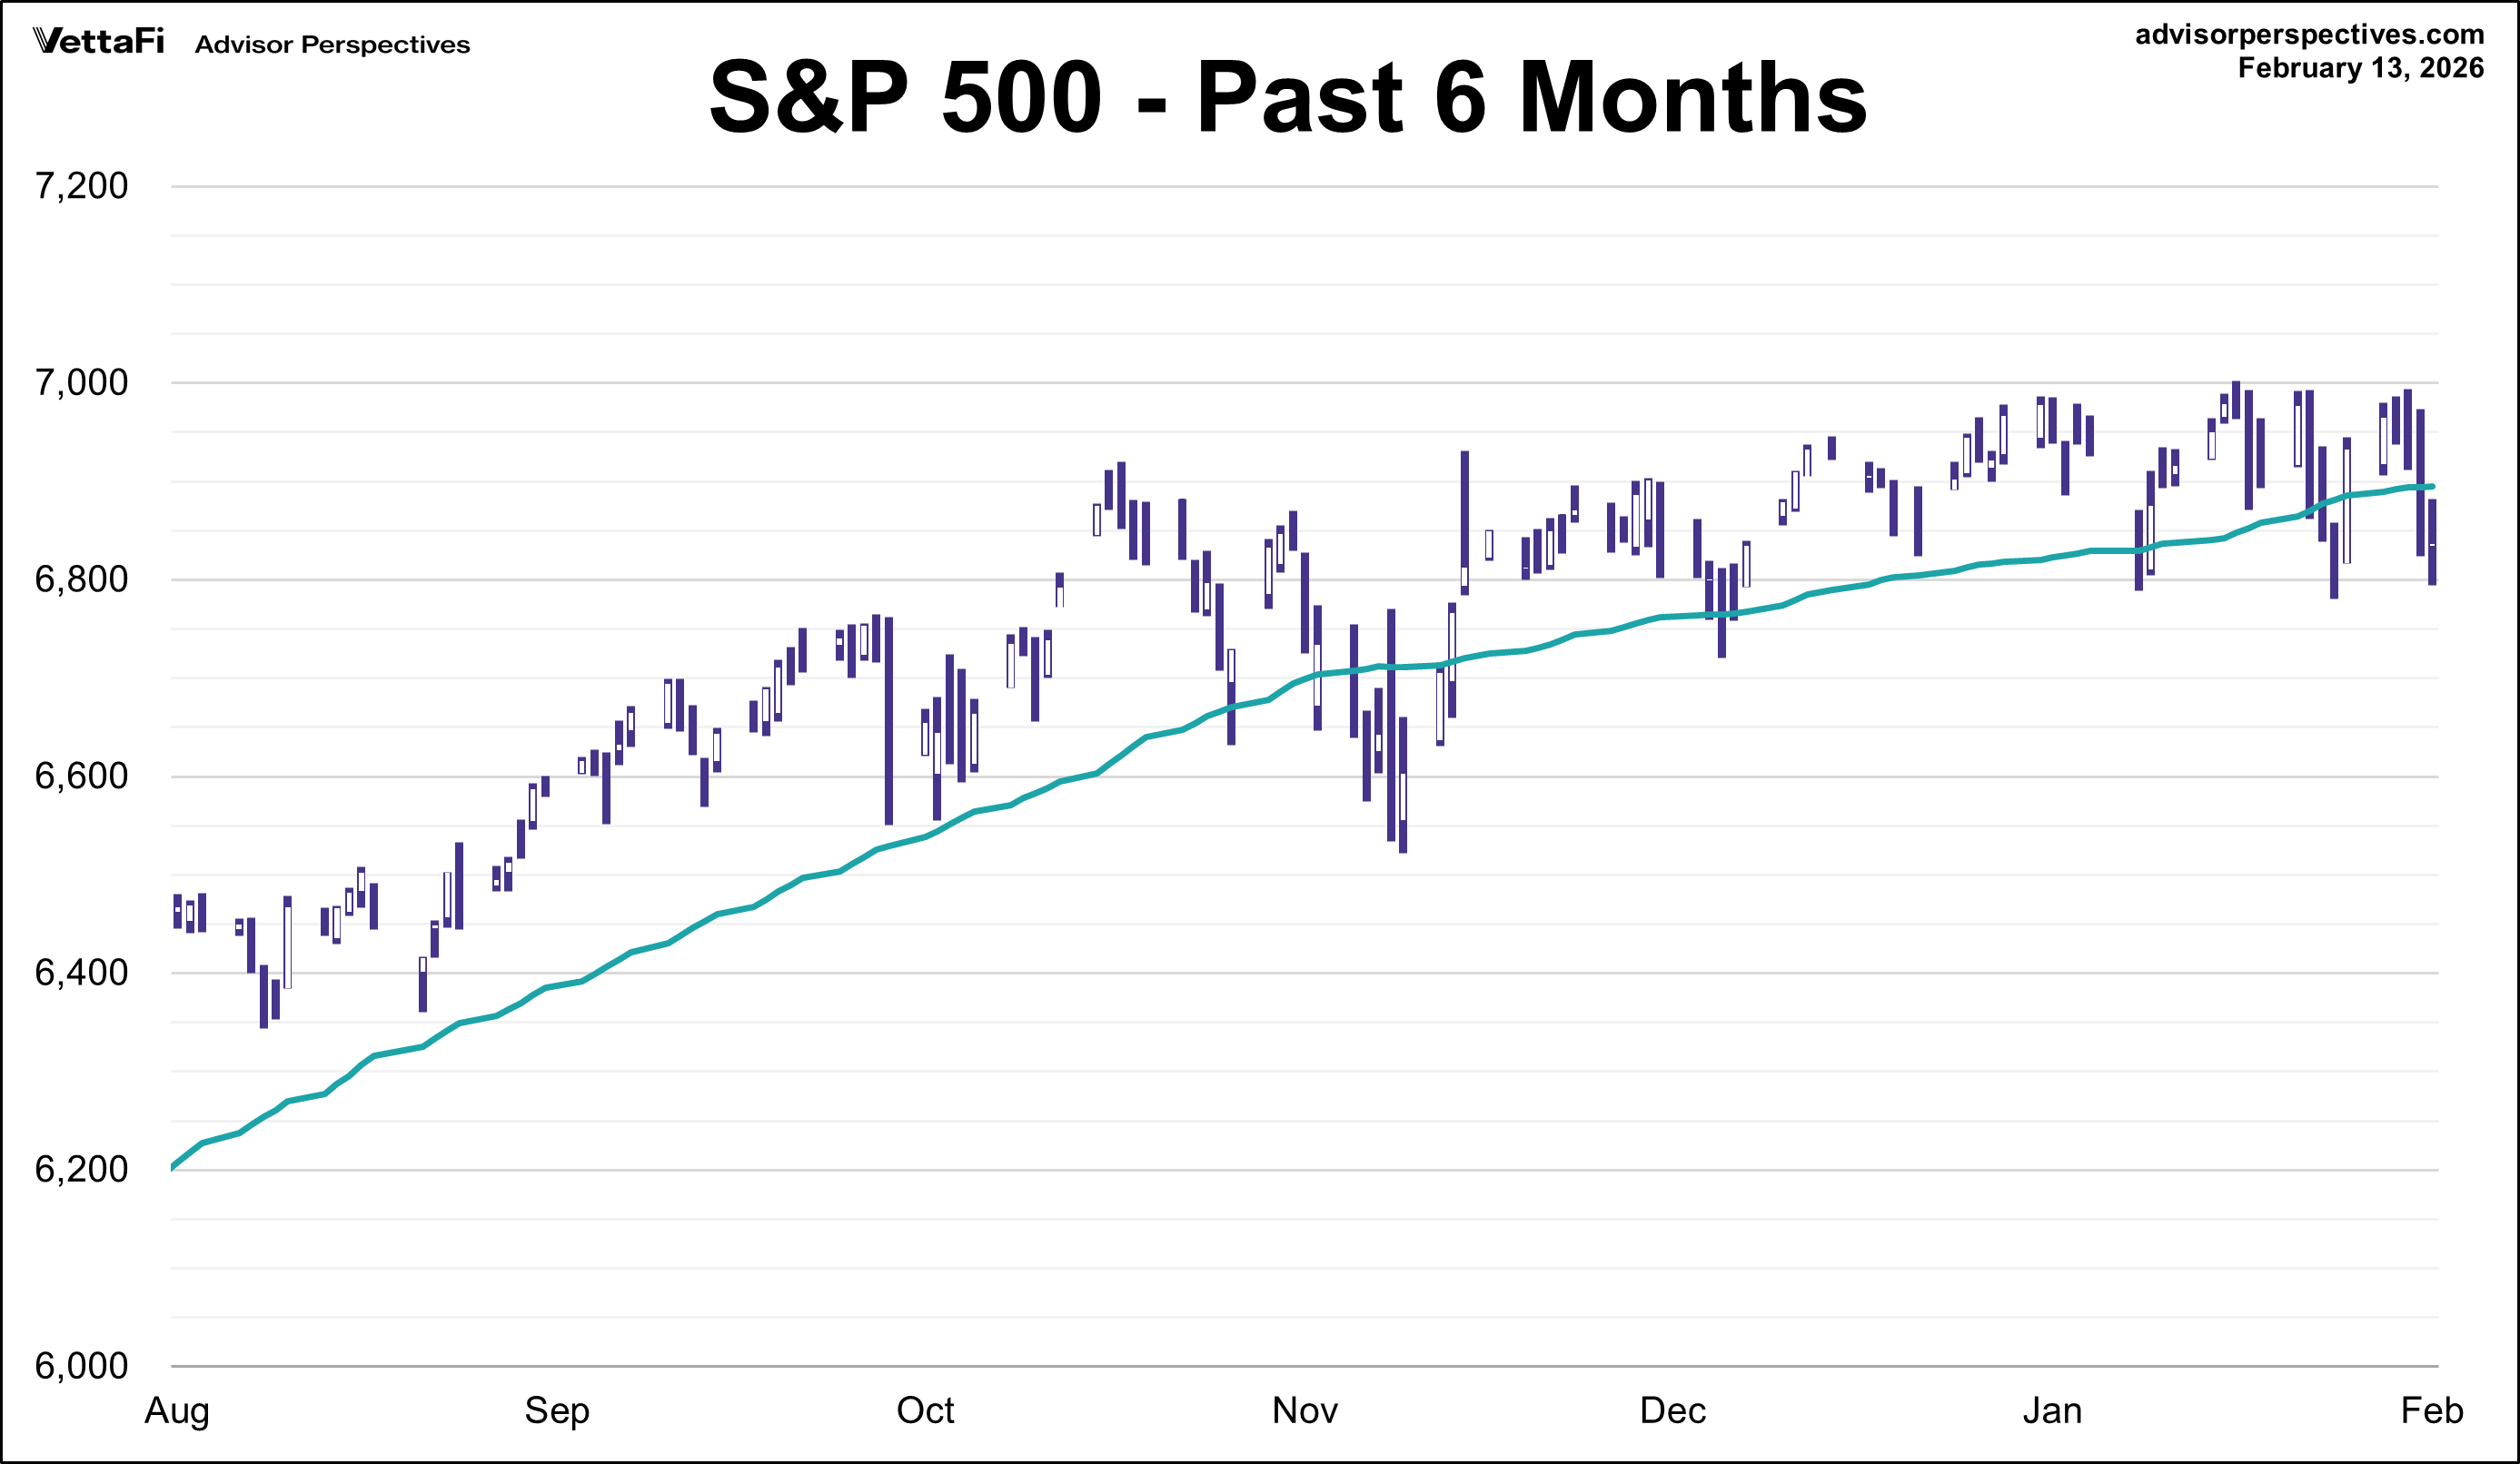
Technical support zones on the S&P 500 near 6,800-6,700 could attract interest on deeper pullbacks, while resistance around 6,900-7,000 continues to cap upside attempts. Upcoming economic indicators, including housing metrics, manufacturing data, and additional earnings reports, will likely guide near-term direction. Broader participation beyond mega-caps will be essential for extending the bull market, as rotation and selective exposure characterize this phase of the cycle.